
Demo AvailableResearch
Performance & Risk Research
Drawdown analytics, performance visualization, historical strategy evaluation, exposure and scenario analysis.
Run thousands of backtests across a grid of parameters, see which regions hold up, and stress-test results with Monte Carlo resampling.
In Development — Targeting December 2026
Synthetic NIFTY 2025-10-01 → 2026-09-18 · 253 sessions · 5-min bars · weekly expiry Tue. Splits by date: train 60 / validation 20 / out-of-sample 20.
| TRAIN | VALID. | OOS | |
|---|---|---|---|
| Trades | 151 | 51 | 51 |
| ₹/trade | +₹770 | +₹503 | +₹313 |
| Net | +116k | +26k | +16k |
| PF | 2.45 | 1.42 | 1.26 |
| Max DD | −13k | −23k | −29k |
Testing many combinations raises the chance a result holds only by luck — prefer broad stable regions.
HYPOTHETICAL · SYNTHETIC DATA. Capital basis ₹2,00,000. Simulated results do not indicate future returns. Not advice.
Demo data · simulated feed. Illustrative only — not live market data and not investment advice. Try it: click rows, tabs and controls.
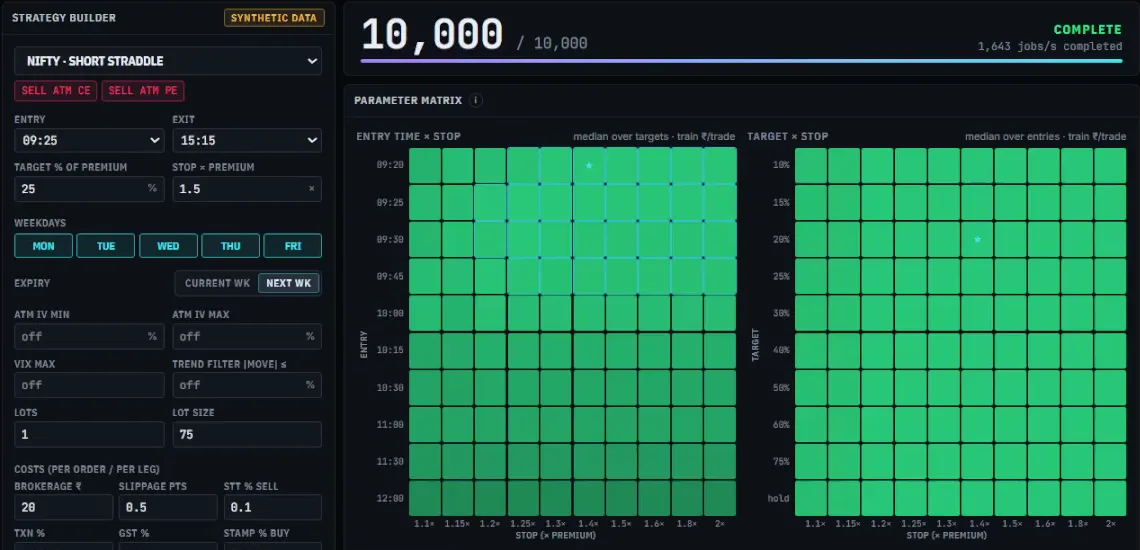
A single backtest is one roll of the dice: change the entry time or the stop slightly and the result can look completely different. Backtest Factory runs the same strategy across thousands of parameter combinations at once — entry time, stop, target, expiry and more — and shows the results as heatmaps, so you can see whether a result sits on a broad, stable region or on a lucky peak.
Results are split into training, validation and out-of-sample periods, costs and slippage are always included, and a Monte Carlo survival chamber reshuffles the trade sequence thousands of times to show the range of drawdowns the same trades could have produced. Everything is hypothetical research on historical data.
Demonstrated in the ORVINUS feature series
A screen from the working prototype shown in the ORVINUS demonstration series.
Intended capabilities. The released feature may differ.
Thousands of combinations of entry, exit, stop, target and filters tested in one run.
Results by parameter pair, so broad stable regions stand out from isolated peaks.
Training, validation and out-of-sample periods reported side by side.
Thousands of reshuffled trade sequences with drawdown percentiles and risk-of-ruin.
Brokerage, taxes and slippage applied to every simulated trade.
Drawdown analytics, performance visualization, historical strategy evaluation, exposure and scenario analysis.
Many small paper-trading bots, each watching one specific setup — when one fires, you see exactly which conditions it checked and why.
Replay past sessions bar by bar with full playback controls — to study setups and practice decisions without hindsight.
Register your interest in the ORVINUS Trading Terminal and tell us that Backtest Factory is what caught your attention.
Registration records your interest. It does not guarantee access to testing or the product.