
In DevelopmentAI Intelligence
Macro Dashboard
The cross-asset backdrop on one screen: indices, the US dollar, yields, volatility, central banks and the economic calendar.
A 0–100 pulse score for indices, sectors and commodities on one screen, showing which markets are strongest right now and why.
In Development — Targeting December 2026
S = Σ w′·d·z (z cross-sectional, clipped ±3; d = sign(momentum) for ·dir rows; w′ renormalized over available components) → score = 50 + 50·tanh(S/1.5). S = 2.269. Relative to these 12 markets; not a forecast.
Demo data · simulated feed. Illustrative only — not live market data and not investment advice. Try it: click rows, tabs and controls.
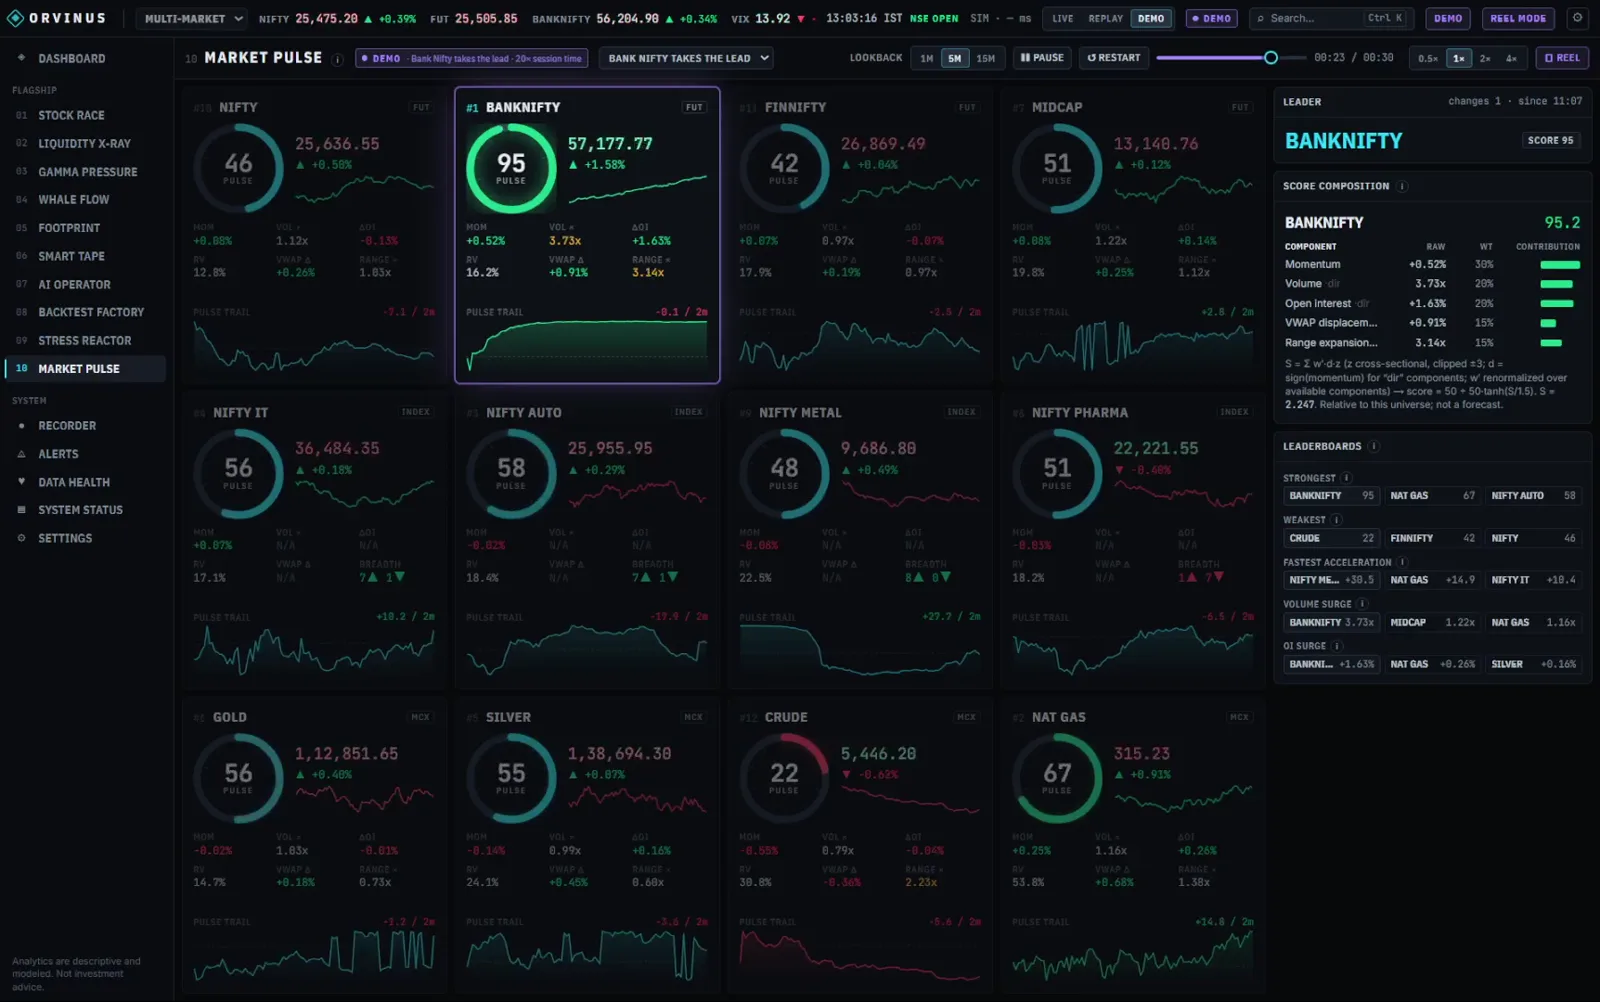
When the session opens, the first question is often where the action is. Market Pulse answers it on one screen: every tracked index, sector and commodity gets a pulse score from 0 to 100, built from momentum, relative volume, open-interest change, VWAP displacement and range expansion, measured against the rest of the group.
The score is never a black box. Select any market to see each component, its weight and its contribution, alongside leaderboards for the strongest, weakest, fastest-accelerating and highest-volume markets. Scores describe current conditions relative to the group; they are not forecasts.
Demonstrated in the ORVINUS feature series
A screen from the working prototype shown in the ORVINUS demonstration series.
Intended capabilities. The released feature may differ.
A 0–100 score with price, change and a short trail for each market.
Every component, its raw value, weight and contribution, with the formula shown.
Strongest, weakest, fastest acceleration, volume surges and open-interest surges.
NIFTY, BANKNIFTY, FINNIFTY, midcaps, sector indices and MCX gold, silver, crude and natural gas.
The cross-asset backdrop on one screen: indices, the US dollar, yields, volatility, central banks and the economic calendar.
A live, ranked race of stocks by momentum, change or breakout score, so the market's leaders and every overtake are visible at a glance.
Estimated gamma exposure by strike, showing where options positioning may amplify or dampen moves in the underlying.
Register your interest in the ORVINUS Trading Terminal and tell us that Market Pulse is what caught your attention.
Registration records your interest. It does not guarantee access to testing or the product.